
Recent market turmoil underscores the complexity of the economic and investment landscape. Rapidly changing news can quickly alter the narrative from one day to the next. War in the Middle East and soaring oil prices are the latest crises threatening to upend markets and dampen economic growth.
Given the uncertain environment, you may have doubts about your investment approach. It is natural to seek calmer shores when markets are choppy. But it is equally important to step back, gain perspective, and look toward the horizon. History shows the S&P 500 Index has always recovered from previous declines, though there are no guarantees. Here are five insights to help you stay the course.
Suspendisse non sapien in sem vehicula bibendum. Curabitur egestas erat sed vulputate mattis. Proin tempor velit ac arcu venenatis condimentum. Ut id velit nunc. Etiam ullamcorper sapien non diam tincidunt fringilla. Vestibulum ac auctor odio, vitae dignissim justo. Aenean quis risus faucibus.
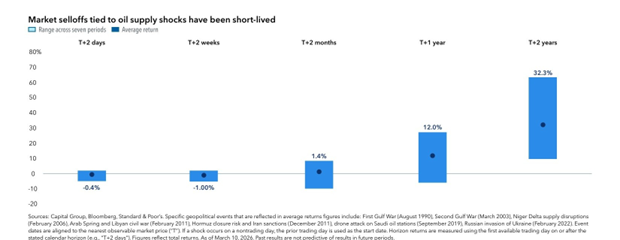
Think back to early 2022. Russia’s invasion of Ukraine delivered a geopolitical shock that rattled markets and dominated headlines, much like today. Brent crude climbed nearly 30% to a high of $128 per barrel while central banks led by the Federal Reserve moved aggressively to raise interest rates.
The S&P 500 fell 19% in 2022. But it staged a powerful rebound in 2023, gaining nearly 24% as inflation cooled, energy markets stabilized, and earnings proved more resilient than many investors expected. The episode serves as a reminder that markets often absorb shocks faster than headlines suggest.
Our read: Short-term pain has historically not determined long-term outcomes. Across seven geopolitical oil shocks, the average S&P 500 return one year later was +12%, and +32% two years later. Staying invested through the discomfort is what captures that recovery.
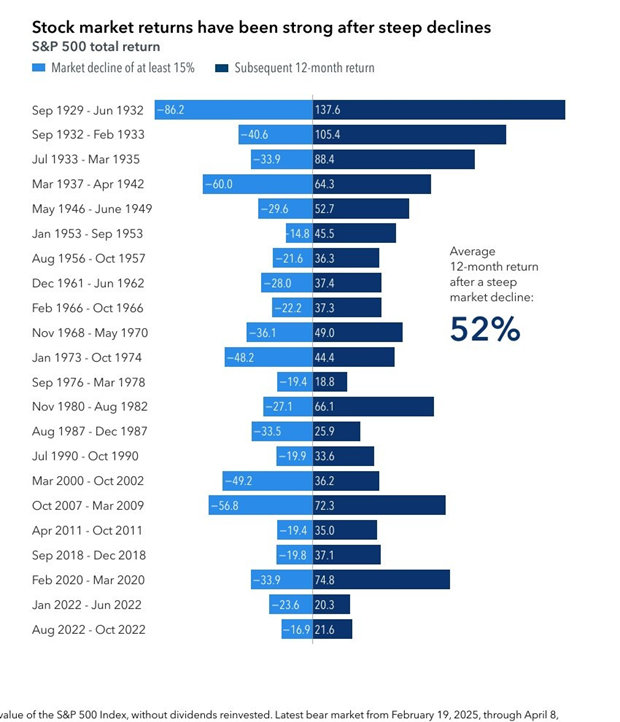
Although markets declined during volatile periods, they often bounced back quickly. The average 12-month return immediately following a 15% or greater S&P 500 decline is 52%. How often have corrections of 10% or more turned into entrenched bear markets? Not often. A drop of 5% occurred on average twice per year, while corrections of 10% or more happened every 18 months on average. And 38 of the last 50 calendar years finished with positive returns.
Following a decline of 15% or greater in the S&P 500 Index
Our read: Every single period of steep decline in the chart above was followed by a meaningful recovery. The pattern is consistent across 22 episodes spanning nearly a century. That does not guarantee future results, but it is a powerful body of evidence for staying invested.
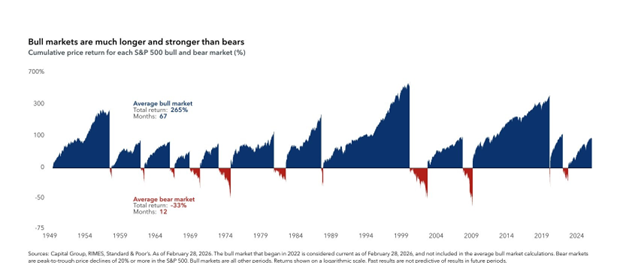
Since 1949 there have been 11 periods of 20%-or-greater declines in the S&P 500. Although the average 33% decline during these cycles is painful to endure, missing out on the average bull market’s 265% return could be far worse. Bear markets last an average of 12 months. Bull markets last an average of 67 months. The asymmetry is striking.
Our read: The pain of a bear market is real but temporary. The gains of a bull market are also real and historically far larger. Enduring the 12 months to access the 67 is the fundamental bargain of long-term investing.
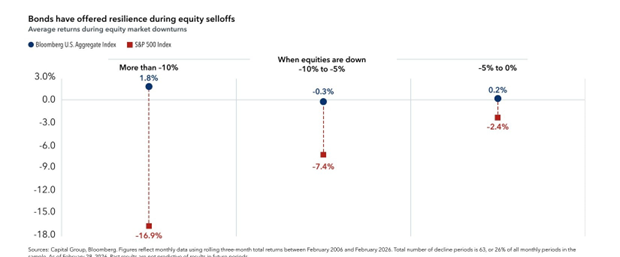
In periods of slowing economic growth, bonds often shine brightest. It is the reason high-quality core bonds are often the foundation of a classic 60/40 portfolio. Bonds are known to zig when equity markets zag. Because yields are higher today following the Federal Reserve’s rate-hiking cycle in 2022, bonds currently offer a more meaningful income cushion to absorb price volatility should rates rise further.
The chart below illustrates this plainly: when equities fell more than 10%, high-quality bonds averaged a +1.8% return over the same period. Bonds do not eliminate risk, but they can meaningfully reduce it.
Our read: Portfolio diversification is not just an abstract principle. It is a demonstrated pattern in the data. When stocks fall sharply, high-quality bonds have historically absorbed part of the blow. That balance is a core reason we construct portfolios the way we do.
When markets are volatile, it is hard to resist the urge to do something. But in many cases, the best course of action has been none at all. Consider the sweeping tariffs of spring 2025: the S&P 500 plunged as much as 18.7% from its February peak. By year-end it had fully recovered and finished up 17.9%. Investors who sold near the bottom locked in losses. Investors who stayed the course participated in the recovery.
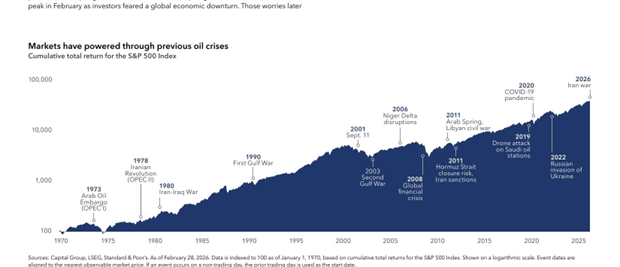
The chart below shows every major crisis since 1970 plotted against the long-run S&P 500 total return. Each crisis looks significant at the time. On the long-run chart, each one is a blip on a line that continues higher.
Our read: Every crisis on that chart felt different in the moment. Every one of them eventually became a footnote on a chart that keeps going up. We do not know when this uncertainty will resolve. What we do know is that the plan we built together was designed for exactly this kind of environment.
KEY TAKEAWAYS
Five things to remember when markets are unsettling.
01. Market volatility can be painful, but markets have often absorbed shocks faster than headlines suggest.
02. The average 12-month return immediately following a steep market decline is 52%, based on historical data.
03. The average bear market lasts 12 months. The average bull market lasts 67 months and gains 265%.
04. In periods of slowing growth, bonds have historically offered balance, rising when equities fall sharply.
05. Staying the course has historically served long-term investors far better than reacting to fear.
IMPORTANT DISCLOSURES This communication is for informational and educational purposes only and does not constitute investment advice. The views expressed are those of Integrative Wealth Partners and are not necessarily the opinion of Cetera Wealth Services, LLC. Nothing herein should be construed as an offer to buy or sell any security. All investing involves risk, including possible loss of principal. Past performance is not indicative of future results. Investments are not FDIC-insured, nor are they deposits of or guaranteed by a bank or any other entity, so they may lose value. Charts and data sourced from third-party research providers including Capital Group, Bloomberg, RIMES, LSEG, and Standard & Poor’s. Integrative Wealth Partners has not independently verified all third-party data. The S&P 500 Index is unmanaged; investors cannot invest directly in an index. The Bloomberg U.S. Aggregate Bond Index represents the U.S. investment-grade fixed-rate bond market. References to specific indices or asset classes are for educational purposes only and do not constitute a recommendation to buy or sell any investment product. |
